Fitness of Populations with ‘growthrates’
1 Introduction
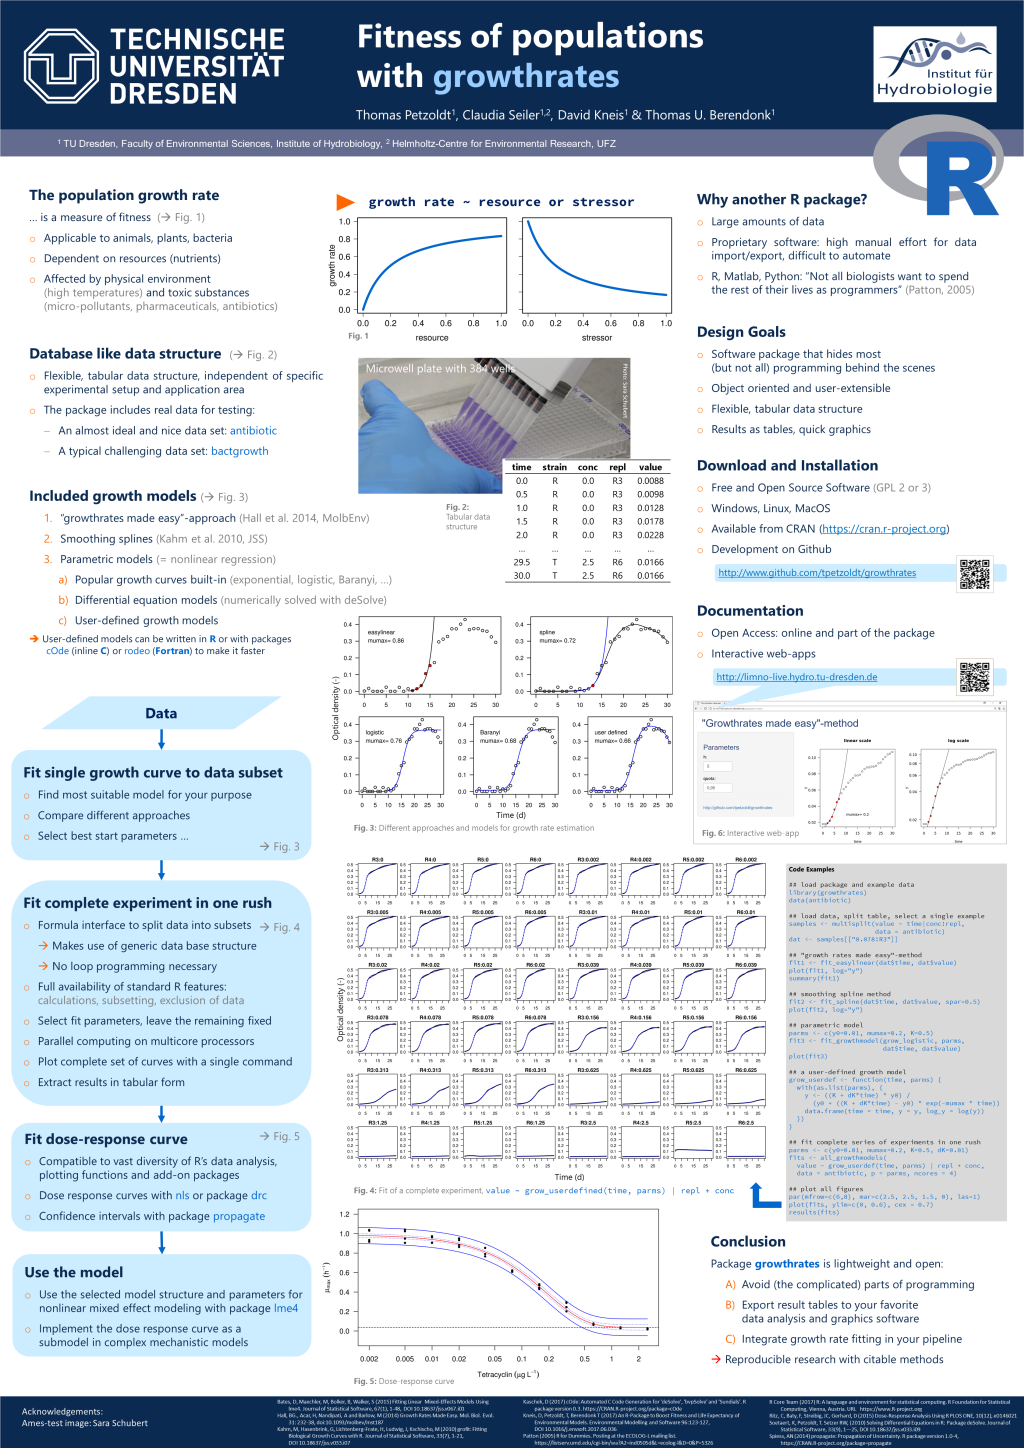
The population growth rate is the main indicator of population fitness. R package growthrates provides a collection of methods to estimate growth rates from experimental data, in particular from batch experiments and microwell plate reader trials. This page is part of an experimental service, to demonstrate parts of the package interactively. The package can be downloaded from CRAN and the complete documentation also from github.
Please see terms and conditions at https://limno-live.hydro.tu-dresden.de.
2 Demos
The demos at this page are interactive. Just play with the options and see what happens. The service is provided as is and without any warranty, comments and bug reports are welcome.
2.1 Growthrates Made Easy
This demo shows parts of an algorithm, originally proposed by Hall et al. (2014) for estimating the maximum population growth rate from log-transformed data.
A linear regression is fit through all segments of h succesive points to find the segment of steepest (exponential) increase. Then, more and more points are added, as long as the slope does not fall below a limit of quota (by default 95%) of the original slope. Please consult the original paper of Hall et al (2014) for details and the original software.
2.2 Smoothing Splines
A cubic smoothing spline is fit the log-transformed data. The maximum of the first derivative is used to indicate the steepest increase. The smoothing parameter spar is determined by generalized cross-validation (GCV) by default. This automatism is not always the best approach, because the data of many growth experiments are serially cross correlated (are pseudoreplicates). This is o.k, when the estimated maximum growth rates are used for further analyses, but makes GCV (and also confidence intervals) unreliable. It may be wise to select the smoothing parameter spar visually in this case.
2.3 Parametric models
Package growthrates comes with a set of pararametric growth models built-in, that should be sufficient for many application scenarios. The functions differ if and how a saturation phase (carrying capacity) or a lag phase is considered. A big literature exists about this and the growthrates package does not provide something new. We just try to make things easier. Here, we give a few examples for getting a first idea which function to use. After selecting a function, a dynamic link at bottom left directs you to the R help file of the respective function.
After selecting a suitable model, it can be fitted with the R growthrates package on your PC. A detailed documentation is found here, including some advice how define growth models, if your favorite model is not in the list.
3 More information
3.1 Downloads

- Talk from the useR!2017 Conference, Brussels. pdf
- Poster from the Conference of the German Limnological Society (DGL), Cottbus 2017. image, pdf
- growthrates package from CRAN
3.2 References
Bates, D, Maechler, M, Bolker, B, Walker, S (2015) Fitting Linear Mixed-Effects Models Using lme4. Journal of Statistical Software, 67(1), 1-48, https://dx.doi.org/10.18637/jss.v067.i01
Hall, BG., Acar, H, Nandipati, A and Barlow, M (2014) Growth Rates Made Easy. Mol. Biol. Evol. 31: 232-38, https://dx.doi.org/10.1093/molbev/mst187
Kahm, M, Hasenbrink, G, Lichtenberg-Frate, H, Ludwig, J, Kschischo, M (2010) grofit: Fitting Biological Growth Curves with R. Journal of Statistical Software, 33(7), 1-21, https://dx.doi.org/10.18637/jss.v033.i07
Kaschek, D (2017) cOde: Automated C Code Generation for ‘deSolve’, ‘bvpSolve’ and ‘Sundials’. R package version 0.3. https://CRAN.R-project.org/package=cOde
Kneis, D, Petzoldt, T, Berendonk T (2017) An R-Package to Boost Fitness and Life Expectancy of Environmental Models. Environmental Modelling and Software 96:123-127, https://dx.doi.org/10.1016/j.envsoft.2017.06.036
Patton (2005) R for Dummies. Posting at the ECOLOG-L mailing list. https://listserv.umd.edu/cgi-bin/wa?A2=ind0505d&L=ecolog-l&D=0&P=5326
R Core Team (2017) R: A language and environment for statistical computing. R Foundation for Statistical Computing, Vienna, Austria. URL https://www.R-project.org
Ritz, C, Baty, F, Streibig, JC, Gerhard, D (2015) Dose-Response Analysis Using R PLOS ONE, 10(12), e0146021 https://doi.org/10.1371/journal.pone.0146021
Soetaert, K, Petzoldt, T. Setzer RW, (2010) Solving Differential Equations in R: Package deSolve. Journal of Statistical Software, 33(9), 1-25, https://dx.doi.org/10.18637/jss.v033.i09
Spiess, AN (2014) propagate: Propagation of Uncertainty. R package version 1.0-4,https://CRAN.R-project.org/package=propagate
3.3 Links
- Package growthrates at https://github.com/tpetzoldt
- More interactive demos on this server: https://limno-live.hydro.tu-dresden.de
- Affiliation: TU Dresden, Institute of Hydrobiology
- Author: Thomas Petzoldt, 2017-09-22, fixes: 2023-12-12